
IBEX 35 (Spain) Elliott Wave analysis – Trading Lounge day chart.
IBEX 35 (Spain) Elliott Wave technical analysis
-
Function: Bullish Trend.
-
Mode: Impulsive.
-
Structure: Gray wave 3.
-
Position: Orange wave 3.
-
Direction next higher degrees: Gray wave 3 (started).
-
Details: The gray wave 2 appears to have completed, and now gray wave 3 of orange wave 3 is in progress.
-
Wave cancel invalidation level: 11,330.48.
Analysis overview
The IBEX 35 daily chart analysis based on Elliott Wave Theory indicates a bullish trend in an impulsive phase. The current wave structure highlights gray wave 3 within orange wave 3, signaling continued upward momentum in the market.
The analysis suggests that gray wave 2 has likely completed, allowing gray wave 3 of orange wave 3 to unfold. According to Elliott Wave Theory, wave 3 is typically the most dynamic phase in a bullish trend, often characterized by strong and sustained price movements. This phase could present increased market activity and buying opportunities.
The wave cancel invalidation level is set at 11,330.48. If the price drops below this threshold, the current wave count would be invalidated, necessitating a reassessment of the market outlook. This level acts as a critical point for traders to confirm the continuation of the bullish trend.
Conclusion
The IBEX 35 daily chart presents a positive market outlook, with gray wave 3 advancing as part of orange wave 3. The completion of gray wave 2 supports the potential for further upward movement.
Traders should closely monitor price developments and key levels to confirm the unfolding bullish trend and to identify potential trading opportunities within this structure.
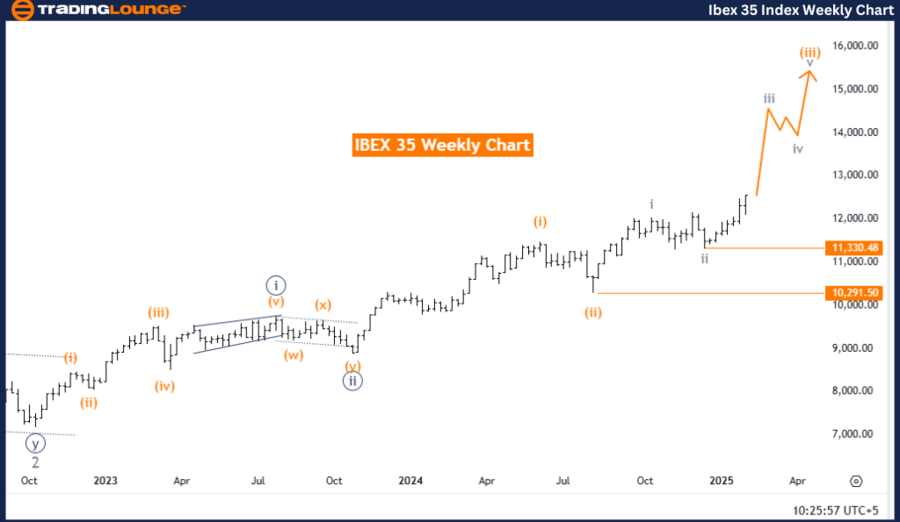
IBEX 35 (Spain) Elliott Wave analysis – Trading Lounge weekly chart
IBEX 35 (Spain) Elliott Wave technical analysis
-
Function: Bullish Trend.
-
Mode: Impulsive.
-
Structure: Gray wave 3.
-
Position: Orange wave 3.
-
Direction next lower degrees: Gray wave 4.
-
Details: The gray wave 2 appears to have completed, and now gray wave 3 of orange wave 3 is in progress.
-
Wave cancel invalidation level: 11,330.48.
Analysis overview
The IBEX 35 weekly chart analysis based on Elliott Wave Theory confirms a bullish trend in an impulsive phase. The current wave structure focuses on gray wave 3 within orange wave 3, signaling sustained upward momentum in the market.
The completion of gray wave 2 indicates that the market has transitioned into gray wave 3, a phase commonly associated with strong price advances in Elliott Wave Theory. This stage is often a defining moment in an ongoing bullish trend, bringing increased market activity and potential buying opportunities.
The analysis suggests that after gray wave 3, the market is expected to enter gray wave 4, which could introduce a correction or consolidation phase. This upcoming phase might slow the market’s upward trajectory before resuming bullish movement. Traders should remain aware of this shift and adjust their trading strategies accordingly.
The wave cancel invalidation level is set at 11,330.48. If the market breaches this level, the current wave count would be invalidated, requiring a reassessment of the market structure. Monitoring this level is crucial for confirming the continuation of the bullish outlook.
Conclusion
The IBEX 35 weekly chart presents a promising market outlook, with gray wave 3 advancing within orange wave 3. The completion of gray wave 2 supports continued upward momentum.
However, traders should remain cautious and prepared for the potential onset of gray wave 4, which may introduce short-term corrections. Closely monitoring the critical invalidation level at 11,330.48 will help traders adapt their strategies effectively.
IBEX 35 (Spain) Index Elliott Wave technical analysis [Video]
Read the full article here


