
Our Elliott Wave analysis today updates the Australian Stock Exchange (ASX) on COLES GROUP LIMITED – COL. We see upside potential in ASX:COL with wave 3‑grey. In the short term, wave 3‑grey is extended, and its wave ii))‑navy is nearing completion as a Zigzag. After wave ii))‑navy completes, wave iii))‑navy could resume the main trend and continue rising.
COL Elliott Wave technical analysis – One-hour chart
-
Function: Major trend (Intermediate degree, Orange).
-
Mode: Motive.
-
Structure: Impulse.
-
Position: Wave ii))‑navy of Wave 3‑grey.
Details:
Since the low at 18.33, wave 3‑grey is extending, subdividing into waves i)), ii)), iii))‑navy. In the short term, wave ii))‑navy is nearing completion as a Zigzag labeled a)b)c)‑orange. Wave c)‑orange could target around 21.10–20.31 before the entire wave ii))‑navy ends. After that, we look for evidence of wave iii))‑navy unfolding.
Invalidation point: 18.33.
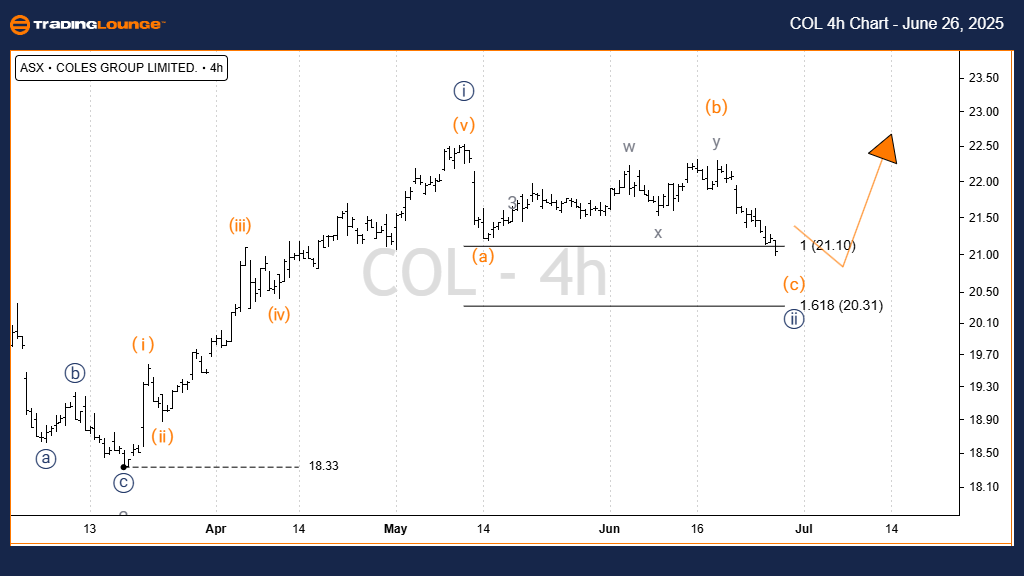
COL Elliott Wave technical analysis – Four-hour chart
-
Function: Major trend (Intermediate degree, Orange).
-
Mode: Motive.
-
Structure: Impulse.
-
Position: Wave c)‑orange of Wave ii))‑navy.
-
Details: Zooming in, wave ii))‑navy continues aiming for the 21.10–20.31 area. Once it completes, wave iii))‑navy may resume, targeting about $30.00.
Invalidation point: 18.33.
Conclusion
Our analysis and forecast provide context on current trends for COLES GROUP LIMITED – COL, highlighting how to capitalize effectively. We offer specific price points that serve as validation or invalidation signals for our wave counts, enhancing confidence in our outlook. Combining these insights, we aim to deliver readers the most objective and professional perspective on market trends.
Coles Group Limited – COL Elliott Wave technical forecast [Video]
Read the full article here


