
Key points:
-
Bitcoin aims for its highest weekly close above $109,000, but higher levels are likely to attract sellers.
-
HYPE, BCH, LINK, and SEI could extend their rallies if Bitcoin price stays above $105,000.
Bitcoin (BTC) made a solid comeback this week, rising more than 6%, indicating strong buying near the $100,000 level. The bulls are trying to strengthen their advantage by sustaining the price above $108,000. Popular trader and analyst Rekt Capital said in a post on X that if Bitcoin achieves its highest weekly close, that “would enable Bitcoin to enjoy a new uptrend into new All Time Highs.”
However, it is worth noting that liquidity generally remains low during the weekend, and a breakout should be viewed cautiously. Sellers will be back on Monday and will try to keep the price within the $100,000 to $111,980 range.
Bitcoin’s strength has triggered buying in several altcoins, which have bounced off their respective support levels. If Bitcoin hits a new all-time high, select altcoins will try to extend their relief rally by breaking above their overhead resistance levels.
Let’s study the charts of the top 5 cryptocurrencies that look strong on the charts and find out their crucial support and resistance levels.
Bitcoin price prediction
Bitcoin has been trading between the moving averages and the downtrend line. Buyers tried to push the price above the downtrend line, but the bears held their ground.
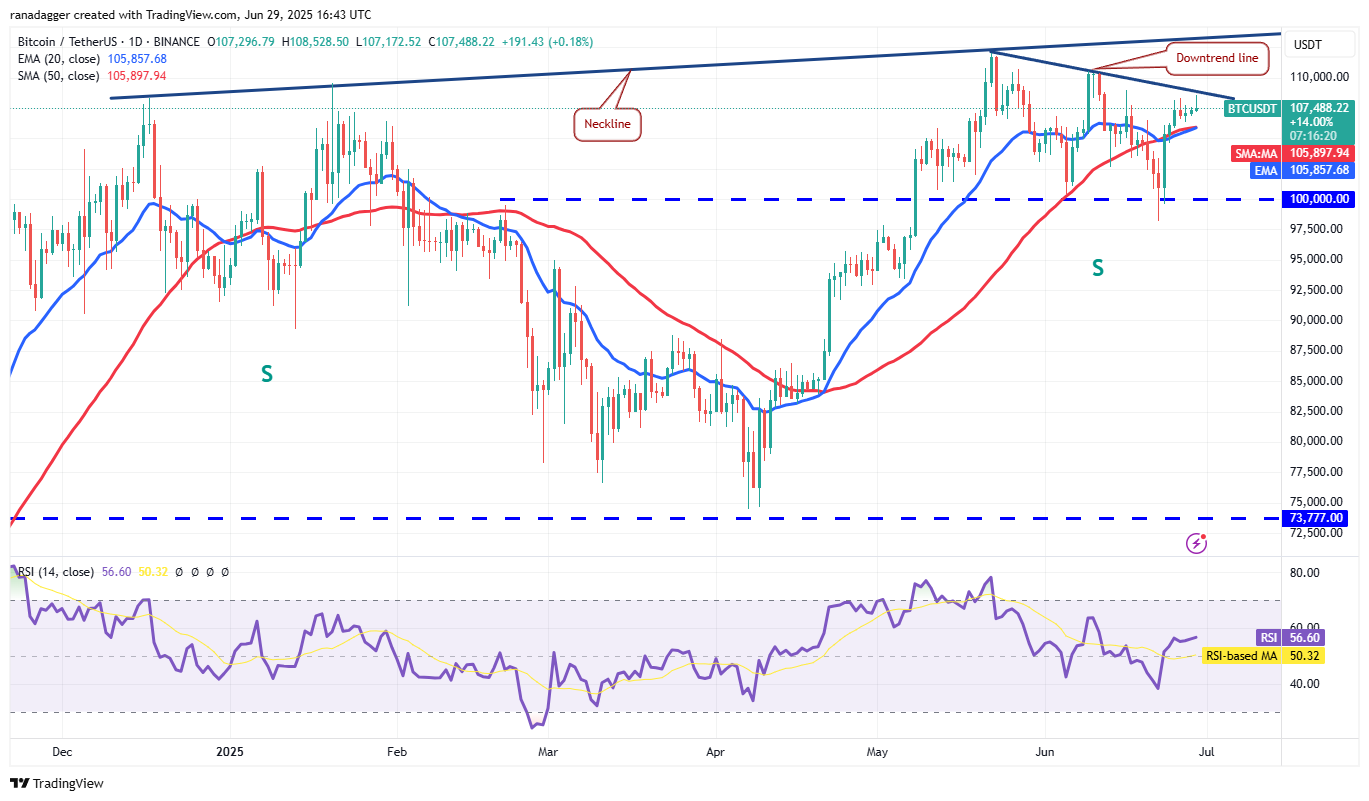
The moving averages are sloping up gradually, and the relative strength index (RSI) is in the positive territory, indicating that bulls have a slight edge. If bulls propel the price above the downtrend line, the BTC/USDT pair could jump to $110,530 and later to $111,980.
Sellers are expected to pose a strong challenge in the zone between the downtrend line and the neckline of the inverted head-and-shoulders pattern. However, if buyers bulldoze their way through, the pair may skyrocket toward $150,492.
This optimistic view will be negated in the near term if the price turns down from the downtrend line and breaks below the moving averages. That opens the doors for a fall to $102,500 and then to $100,000.
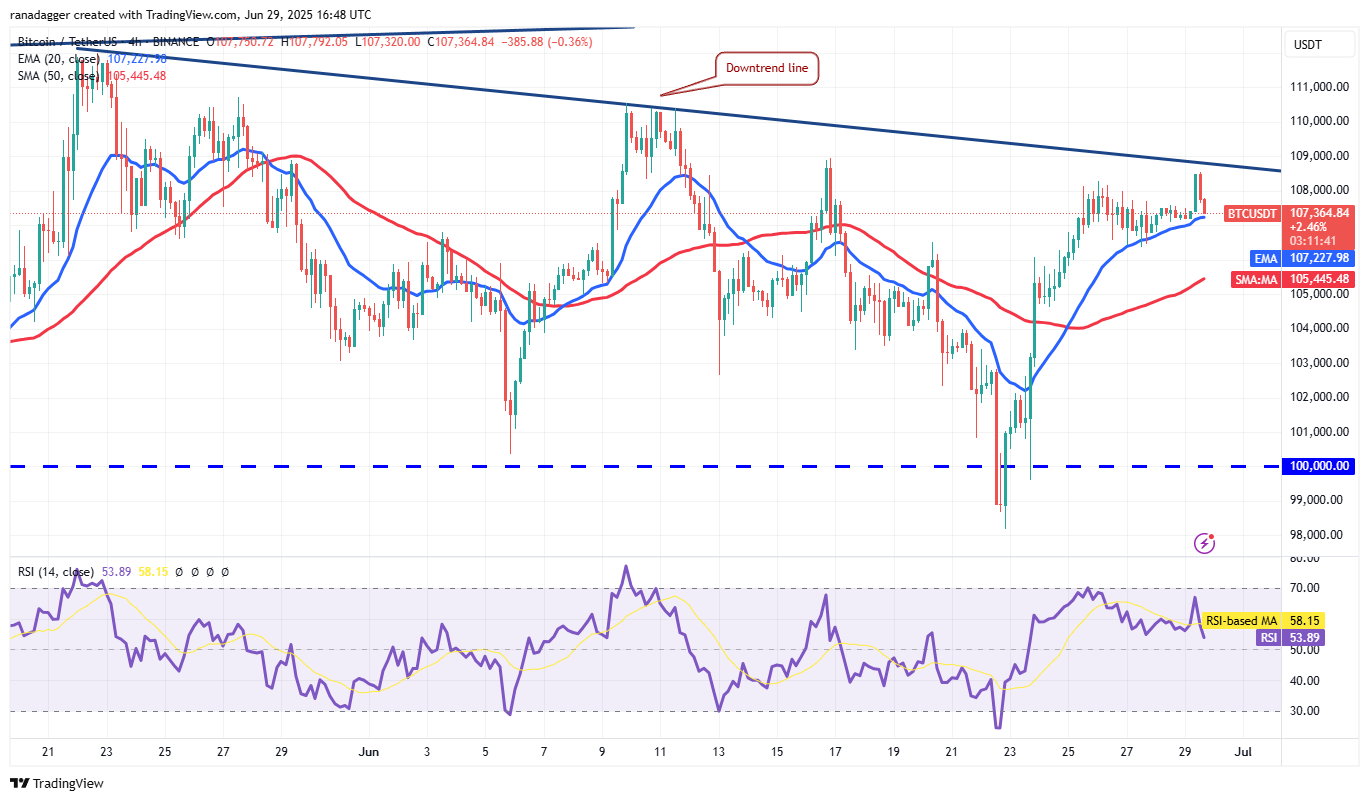
The pair bounced off the 20-exponential moving average, but the bulls could not clear the overhead hurdle at the downtrend line. If the price continues lower and breaks below the 20-EMA, it suggests that the bulls are losing their grip. The pair may then skid to the 50-simple moving average, which is a crucial level to watch out for. A break below the 50-SMA could accelerate selling, pulling the pair toward $100,000.
On the upside, the bulls will have to push and retain the price above the downtrend line to signal strength.
Hyperliquid price prediction
Hyperliquid (HYPE) slipped below the 20-day EMA ($37.14) on Thursday, but the bears could not sustain the lower levels. That shows buying on every minor dip.
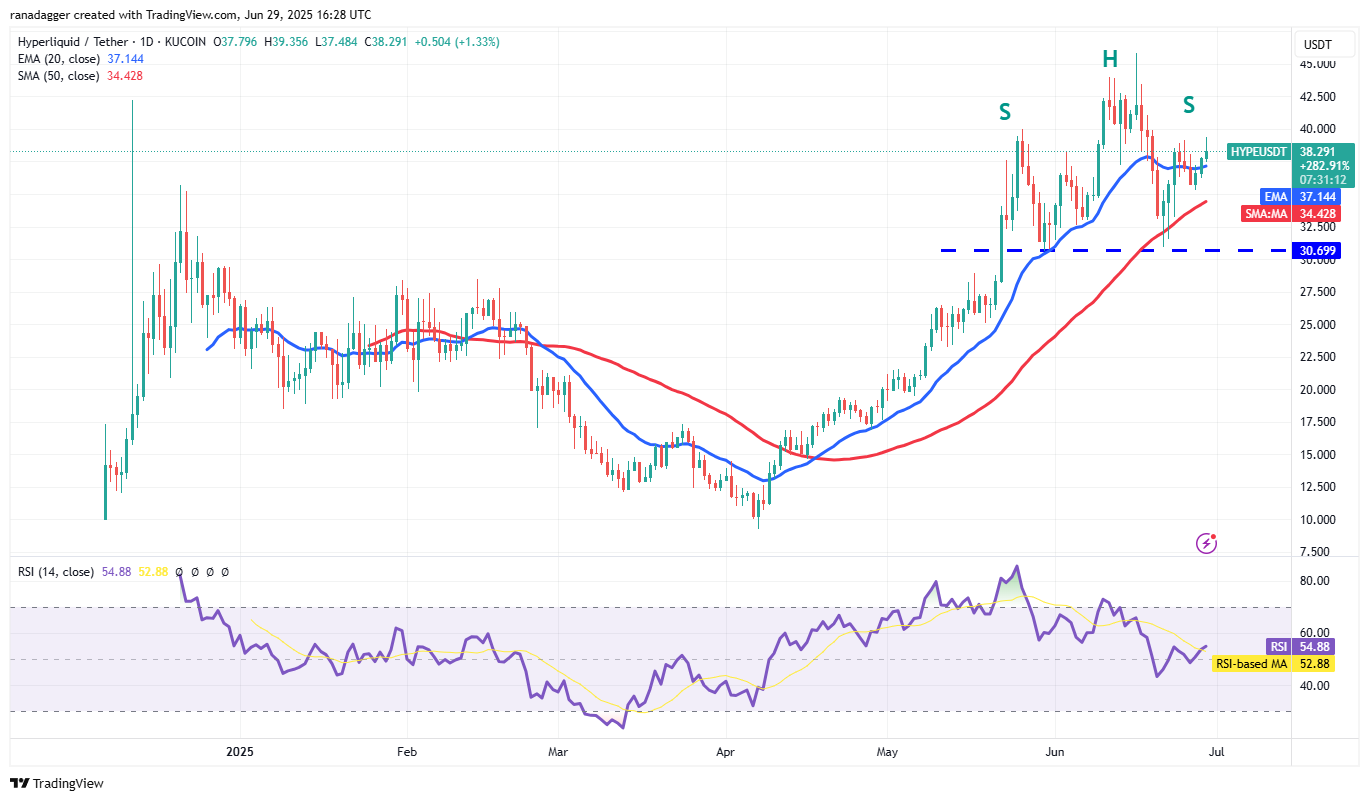
The bulls pushed the price back above the 20-day EMA on Saturday. There is resistance at $39.12, but if the bulls overcome the barrier, the HYPE/USDT pair could surge toward $42.50. Buyers are expected to face significant resistance in the $42.50 to $45.80 zone.
Conversely, if the price turns down and skids below the 20-day EMA, it indicates that bears are active at higher levels. The pair may then slump to the 50-day SMA ($34.42). A break and close below the 50-day SMA could sink the pair to $30.69.
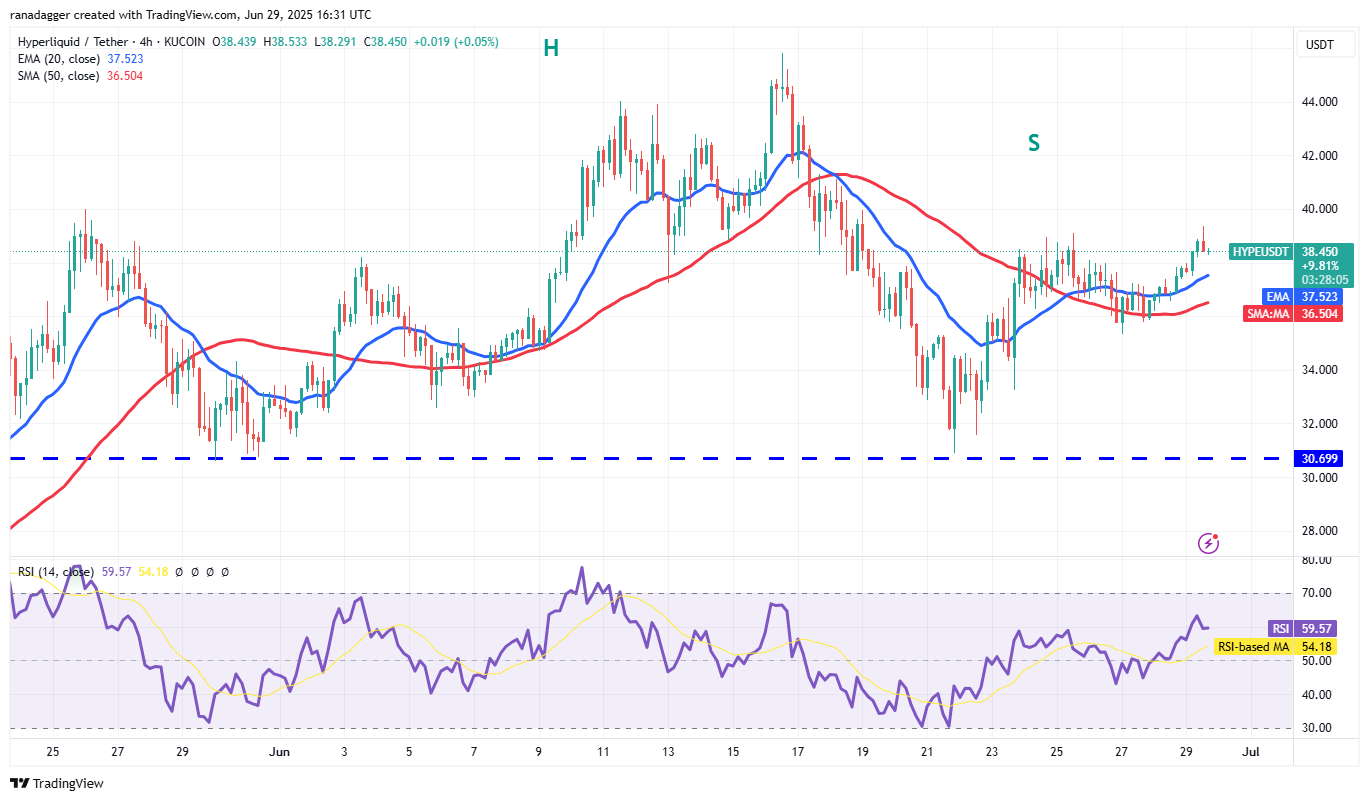
The pair found support at the 50-SMA, and the bulls are trying to push the price above the near-term resistance of $39.12. If they manage to do that, the pair could ascend to $41 and thereafter to $42.50.
The first support on the downside is the 20-EMA and then the 50-SMA. A break below the moving averages signals that the bullish momentum has weakened. The pair may tumble to $33.25 and subsequently to the solid support at $30.69.
Bitcoin Cash price prediction
Bitcoin Cash (BCH) is facing selling at the $500 level, but a positive sign is that the bulls have not ceded much ground to the bears.
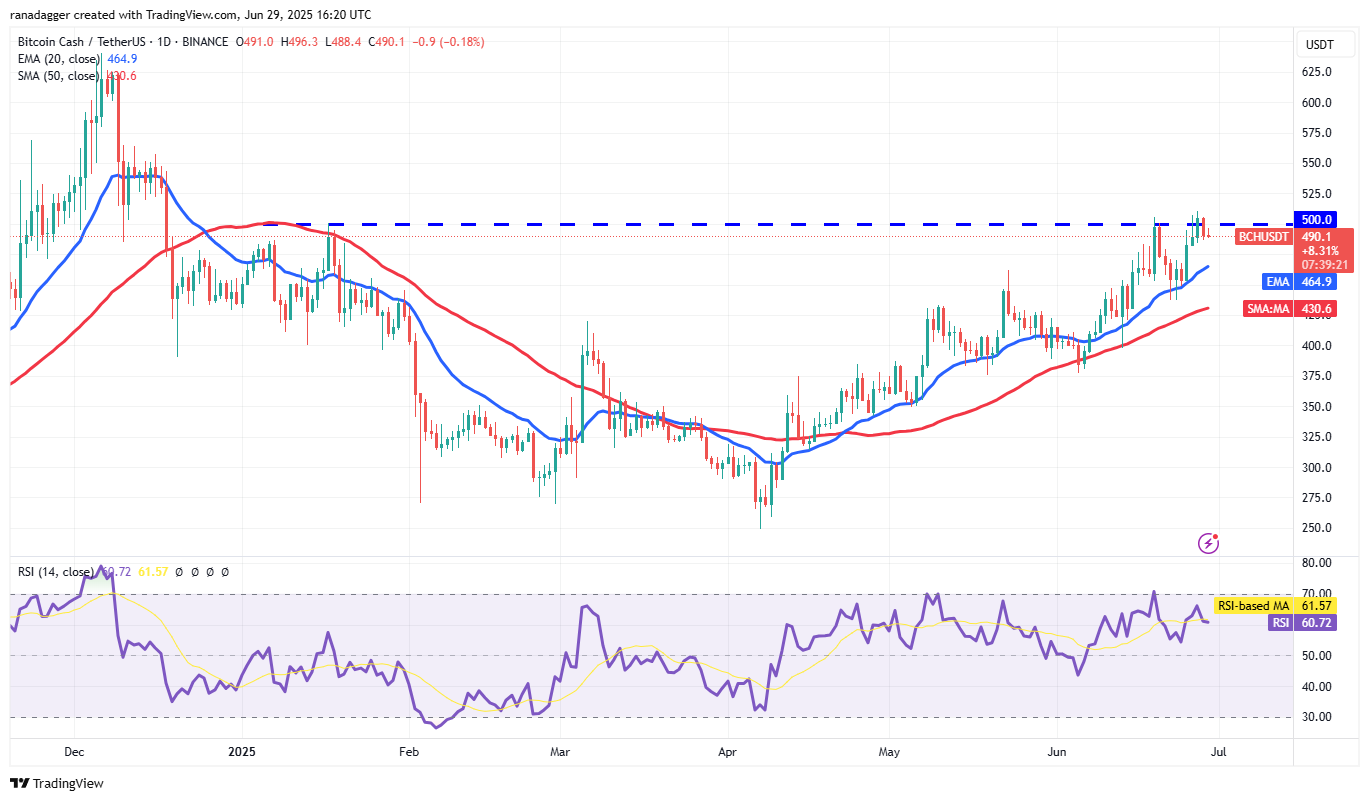
The upsloping moving averages and the RSI in the positive zone suggest that the bulls are in control. That increases the likelihood of a break above $500. If that happens, the BCH/USDT pair could soar to $550. Sellers will try to halt the rally at $550, but if the bulls prevail, the pair could reach $625.
The first support on the downside is at the 20-day EMA ($464) and then at the 50-day SMA ($430). A break below the 50-day SMA signals that the bears are back in the game.
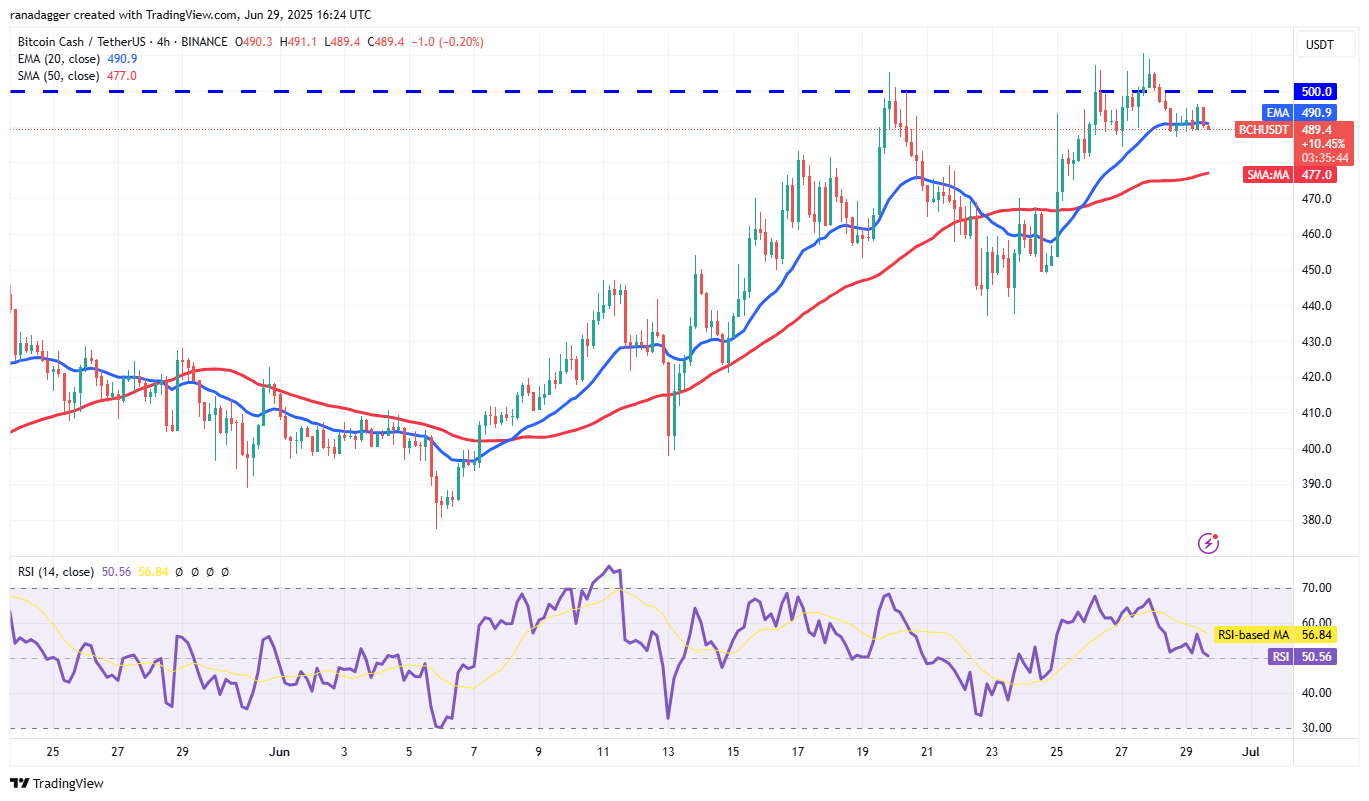
The bulls are trying to sustain the price above the 20-EMA on the 4-hour chart. If they succeed, the pair could once again rise above the $500 resistance. The up move could pick up steam above $511.
On the contrary, if the price breaks and maintains below the 20-EMA, it suggests that the bulls are booking profits. That could sink the pair to the 50-SMA, where the bulls are likely to step in.
Related: Here’s what happened in crypto today
Chainlink price prediction
Chainlink (LINK) has been clinging to the 20-day EMA ($13.27) for the past few days, indicating that the bulls have maintained their pressure.
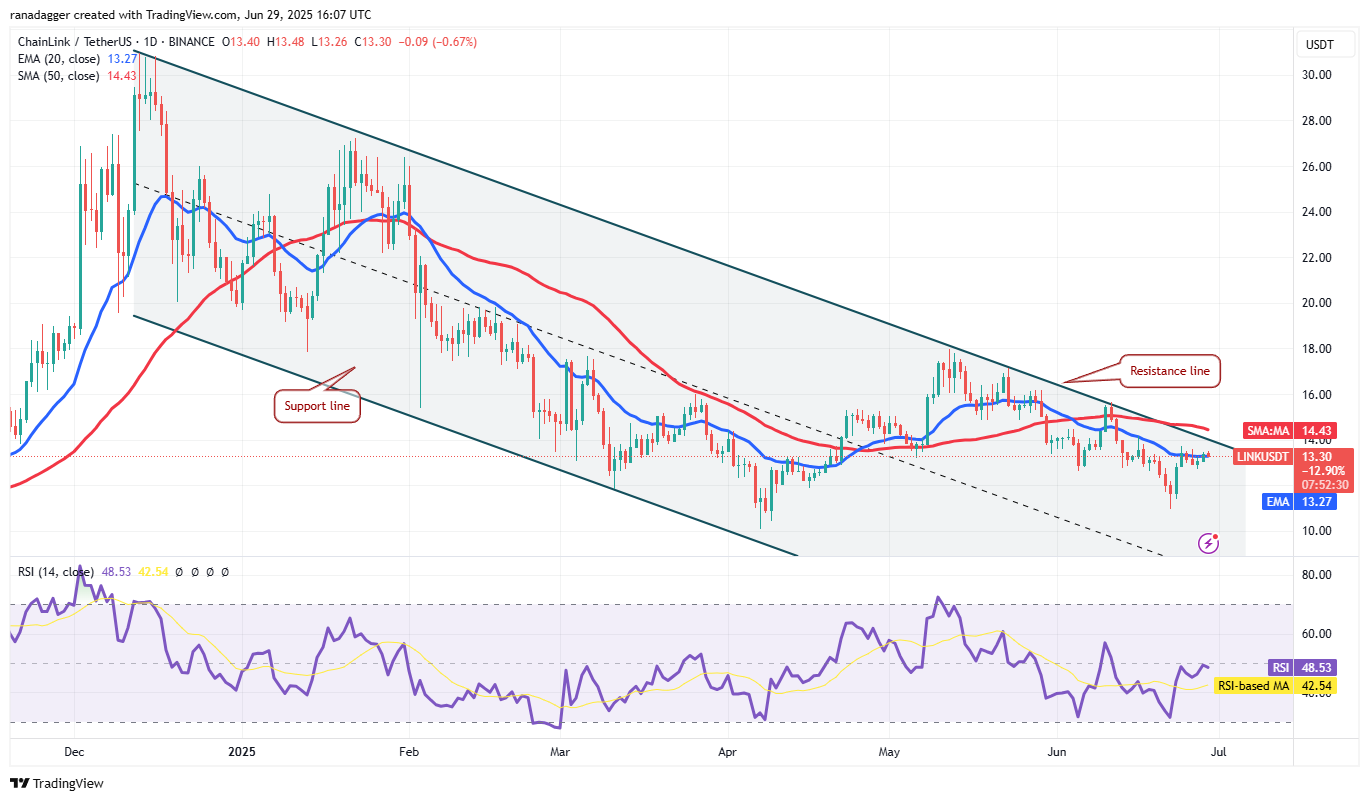
If the price breaks and maintains above the 20-day EMA, the LINK/USDT pair could rise to the 50-day SMA ($14.43). Sellers are expected to defend the 50-day SMA with all their might because a break above it signals a potential trend change. The pair may then climb toward $18.
Instead, if the price turns down sharply from the current level or the 50-day SMA, it suggests that the bears are selling on rallies. A break below $12.73 could keep the pair inside the descending channel for some more time.
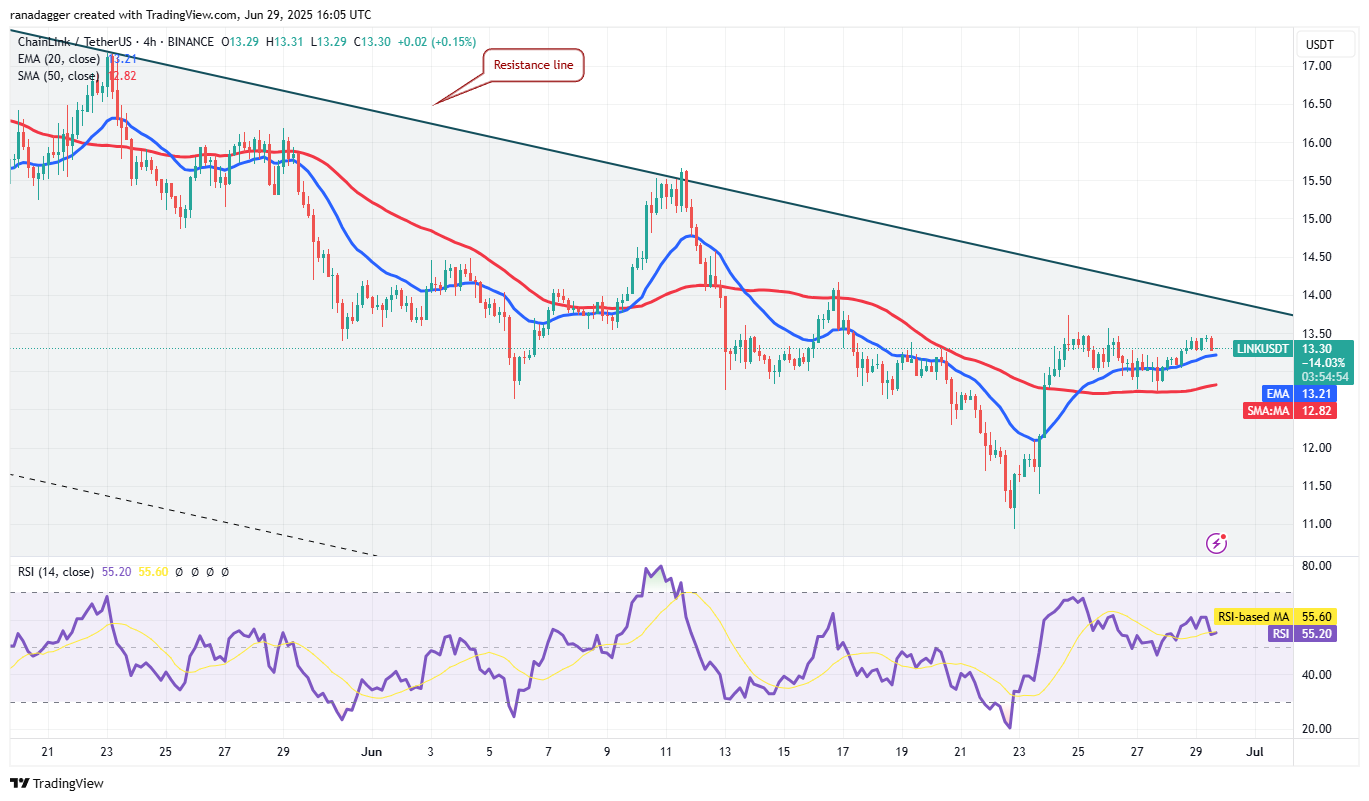
The bulls are trying to push the price to the resistance line, but the bears are aggressively defending the $13.50 level. If the price turns down and breaks below the 20-EMA, it suggests a lack of demand at higher levels. The pair may then descend to the 50-SMA.
Contrarily, a sharp rebound off the 20-EMA signals a positive sentiment. The pair could rise to the resistance line, which is a critical level to watch out for. If the price rises above the resistance line, the pair may march toward $15.50.
Sei price prediction
Sei (SEI) picked up momentum after breaking out of the 50-day SMA ($0.21) on Monday and rose above the $0.29 resistance on Tuesday.
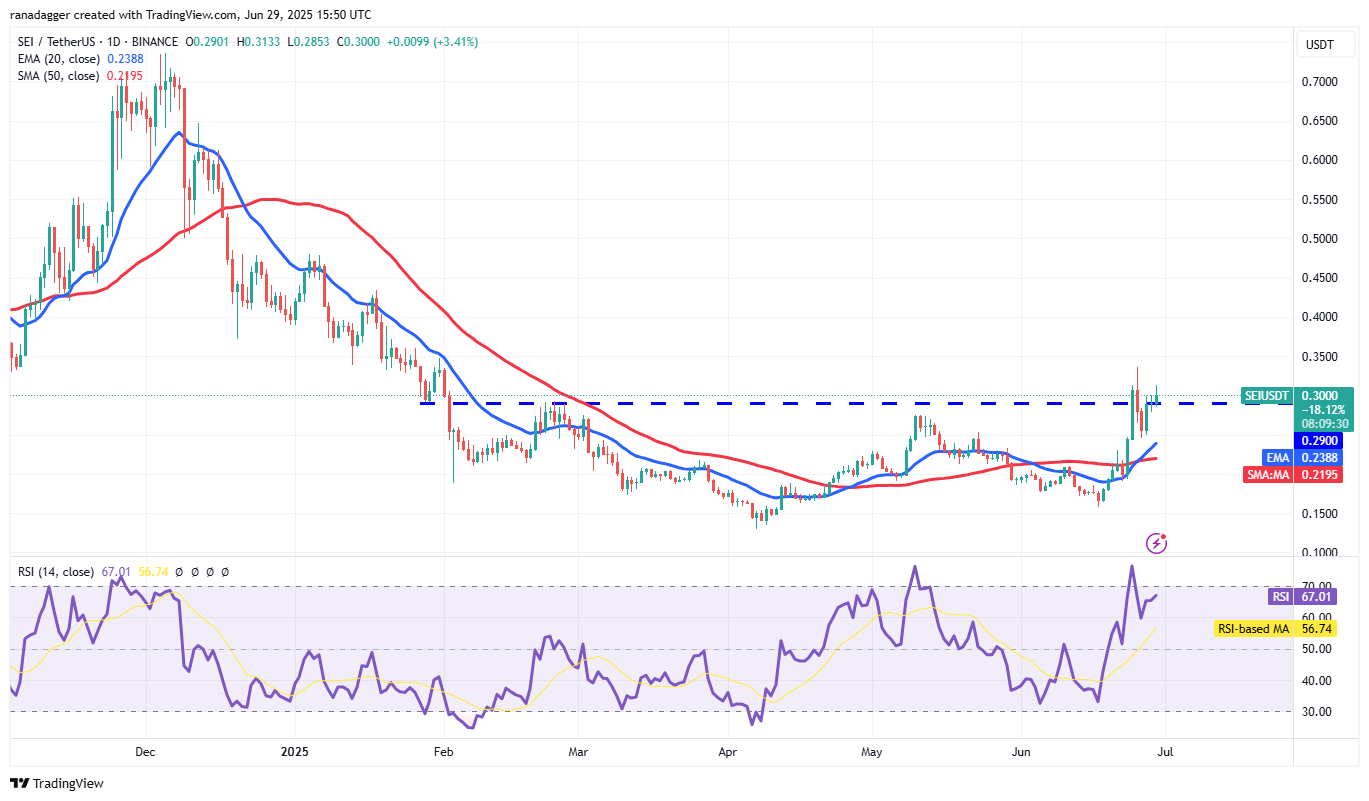
However, buyers could not sustain the higher levels, and the price dipped below the $0.29 level on Wednesday. A positive sign in favor of the bulls is that they pushed the price back above the $0.29 level. The 20-day EMA ($0.23) has started to turn up, and the RSI is in the positive territory, indicating that the path of least resistance is to the upside. The SEI/USDT pair could rise to $0.35 and later to $0.43.
This positive view will be invalidated in the near term if the price turns down and breaks below the 20-day EMA. That could pull the pair down to $0.19 and later to $0.15.
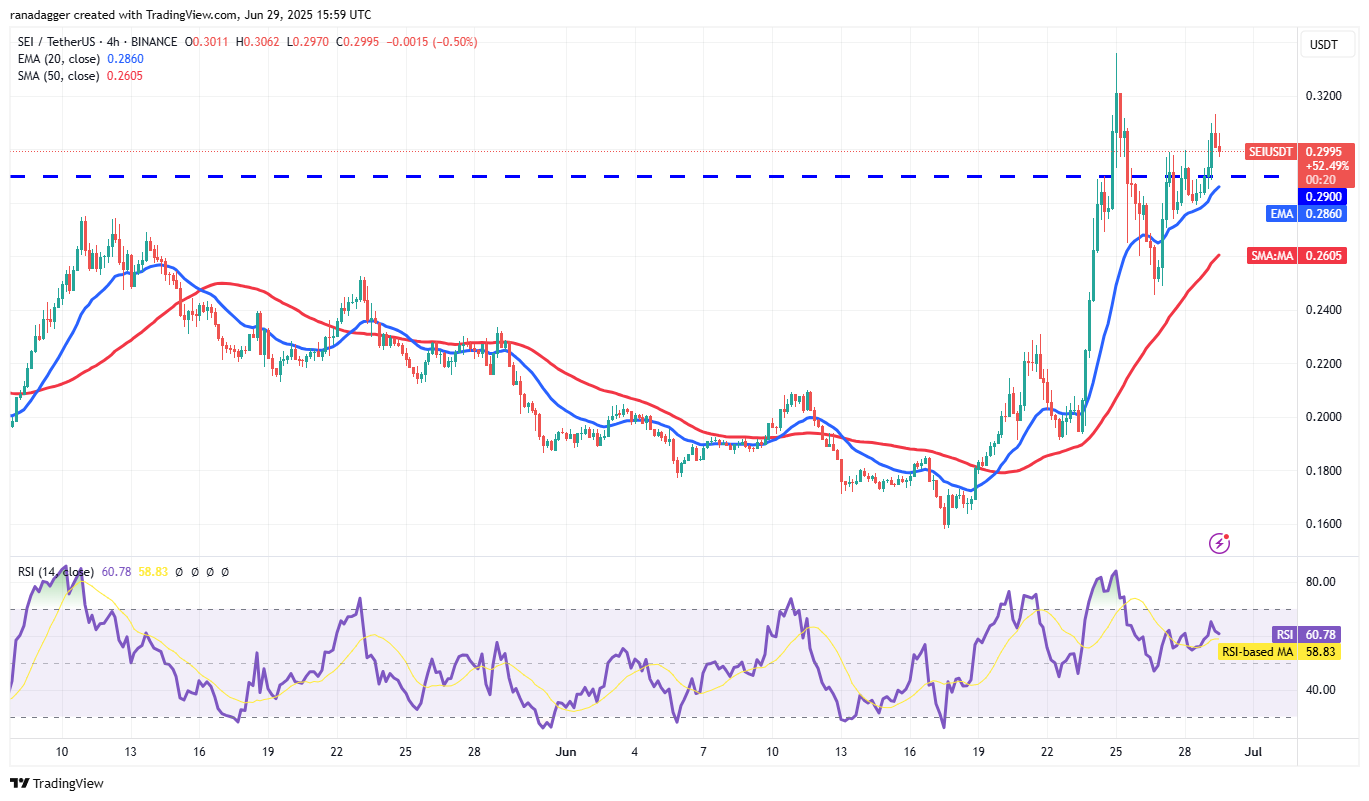
Both moving averages are sloping up, and the RSI is in the positive zone, indicating advantage to buyers. If the price sustains above $0.30, the pair could rally to $0.33.
Sellers are likely to have other plans. They will try to pull the price below the 20-EMA. If they manage to do that, the pair may slide to $0.27 and subsequently to the 50-SMA. Buyers are expected to vigorously defend the 50-SMA because a deeper pullback could delay the resumption of the up move.
This article does not contain investment advice or recommendations. Every investment and trading move involves risk, and readers should conduct their own research when making a decision.
Read the full article here


